Sourcing Statistics SOP
Sourcing Statistics
To get an understanding of the process of sourcing statistics for insights, you need to understand the objective. Statistics and insight pages are used as a link building tactic.
This means, people are going to use our insights on their pages, and externally link to our insights page.
This will help us clearly define the purpose of building an insights page, while allowing us to target the right terms when optimising an insights page.
Step 1: Keyword research is at the core of almost every SEO tactic out there, this is no exception. We must find what statistics people are searching for.
In the example I am about to use, I have been asked to curate a statistics page around “Nursing Depression Statistics”.
So, I will take this keyword to Ahrefs and see if it has any search volume.
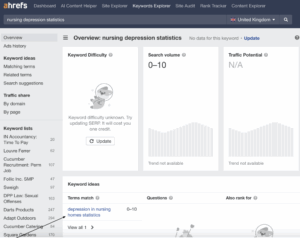
As you can see, the keyword itself gets no searches; but we have been presented with a great opportunity in the terms match at the bottom of the page.
The keyword “depression in nursing homes statistics” is highly relevant to Cucumber, it’s actually being searched (although low volume), and is a very niche term which will be easy to rank high for.
Step 2: Now we need to source our statistics. There are more than one ways to do this. Each method has their own advantages and disadvantages, but can all be useful, even when used in conjunction with each other.
Method 1: ChatGPT
A great feature in ChatGPT is its ability to search the web, it is able to source relevant statistics related to your prompt, and give you the link to the page.
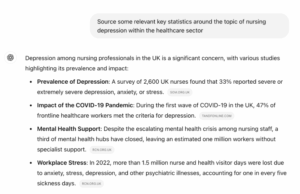
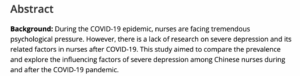
One that immediately jumps out the page is “Prevalence of Depression” which seems like a great statistic, but this is where the next step is crucial in the process.
On inspection of the article linked, it is written in 2020 and doesn’t hold the same relevance today as these stats were skewed by external factors at that time (Covid).
In this case, we can prompt ChatGPT to find more recent statistics around the topic.
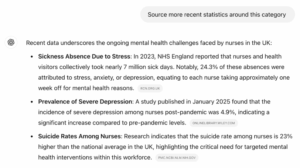
With these revised statistics, the one that jumps off the page to me is “Prevalence of Servere Depression” which, at first glance, seems like a great study brought out recently, with great relevance to the topic. However, this is where the next step comes in.
Background Check on Data
This is a crucial stage as you want to be confident you are using relevant statistics. Although they may seem relevant on the surface, looking into who collected the data, where the data was collected, and the purpose of the data, is crucial in making sure it is relevant.
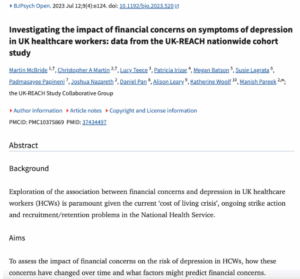
A quick glance at the data for “Prevalence of Servere Depression” shows us that this data was actually sourced in China, which has little relevance to nursing in the UK.
In this case, we can go back to step 2. to find more relevant statistics.
Taking all of the previous points into account, the data I ended up using was the below. As you can see, this data is relevant to the topic of nursing depression, it is relatively recent (2023), and it is a UK study. These statistics hit all of the criteria we are aiming for.
Method 2: Online Databases (Statista)
Sometimes, the best way to find good data is to go straight to the source. There are so many datasets that won’t be indexed on Google, but are easily accessible through online databases, government websites, academic journals for research-based statistics and so on.
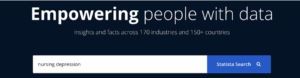
For this example, we will use Statista. It is a gold mine for statistics on any topic you could think of.
So, the first thing to do when you visit Statista, is enter a general term in the search bar related to the statistics you want to find. Here, I have simply typed “nursing depression”
The great thing about statista is the amount of filters you can apply to your search. You can find different types of data, the keywords included in your search term, location, publication date and more allowing you to be as niche with your search as needed.
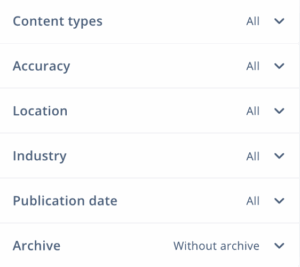
In my example, I have filtered the dates to 2024/2025.
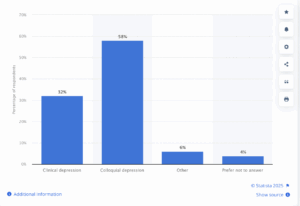
As seen above, I found a highly-relevant (although it is in the US) resource by doing this method. A staggering 32% were reportedly clinically depressed.
Step 3: This data is now ready to be uploaded to your insights page. You can repeat this process using both methods, using the statistics found to build out a highly informative insights page on any website, which will be sure to bring you some links.
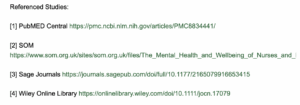
Something to be aware of, you should always reference data used on your website to give proper credit to the source of the information, ensure transparency about where the data came from, allow readers to verify its accuracy by accessing the original source, and avoid potential issues with plagiarism, especially if the data belongs to another entity.